

Backtest with FX Bar Data
Run an EMA cross strategy on USD/JPY 1-minute bid/ask bars with FX rollover interest and a probabilistic fill model. The data comes from the NautilusTrader test data: a source checkout reads it locally, and other installs download it from GitHub on each run, so they need network access.
Introduction
The strategy is EMACross, a teaching example that compares a fast EMA
against a slow EMA on bar closes:
- Fast EMA crosses above slow EMA: any short position is closed and a new long is opened.
- Fast EMA crosses below slow EMA: any long position is closed and a new short is opened.
The venue is a simulated FX ECN with a MARGIN account, HEDGING OMS, and
multi-currency starting balances of 1,000,000 USD and 10,000,000 JPY. A
FillModel introduces a 50% probability of one-tick slippage, and the
FXRolloverInterestModule applies daily rollover at the relevant short-term
interest differential.
EMACross is a teaching strategy and has no edge.
Prerequisites
- Python 3.12+
- NautilusTrader 2.x installed
(
pip install -U --pre nautilus_trader). Thevisualizationextra is only needed if you also want to regenerate the panels at the end of the tutorial. - pandas (
pip install pandas). The wheel declares no runtime dependencies. - The sibling
ema_cross.pyfile. Keep it next to this tutorial when downloading or converting it with Jupytext.
from decimal import Decimal

from nautilus_trader.common import LogLevel
from nautilus_trader.config import BacktestEngineConfig
from nautilus_trader.backtest import BacktestEngine
from nautilus_trader.backtest import FXRolloverInterestModule
from nautilus_trader.backtest import InterestRateRecord
from nautilus_trader.config import LoggerConfig
from nautilus_trader.config import RiskEngineConfig
from nautilus_trader.execution import MakerTakerFeeModel
from nautilus_trader.execution import ProbabilisticFillModel
from nautilus_trader.model import AccountType
from nautilus_trader.model import BarType
from nautilus_trader.model import Currency
from nautilus_trader.model import Money
from nautilus_trader.model import OmsType
from nautilus_trader.model import TraderId
from nautilus_trader.model import Venue
from nautilus_trader.testkit.providers import TestDataProvider
from nautilus_trader.testkit.providers import TestInstrumentProvider

from ema_cross import EMACross
from ema_cross import EMACrossConfig


JPY = Currency.from_str("JPY")
USD = Currency.from_str("USD")
Engine setup
Pre-trade risk checks are bypassed so the strategy's market orders flow straight through to the matching engine.
config = BacktestEngineConfig(
    trader_id=TraderId.from_str("BACKTESTER-001"),
    logging=LoggerConfig(stdout_level=LogLevel.ERROR),
    risk_engine=RiskEngineConfig(bypass=True),
)
engine = BacktestEngine(config=config)
Simulation modules
FXRolloverInterestModule charges or credits rollover interest on open
positions at a fixed 17
short-term-interest.csv rates from the OECD short-term interest series.
Without it a backtest spanning many sessions ignores carry.
provider = TestDataProvider()
interest_rate_data = provider.read_csv("short-term-interest.csv")
interest_rate_records = [
    InterestRateRecord(location=row.LOCATION, time=row.TIME, value=row.Value)
    for row in interest_rate_data.itertuples(index=False)
]
fx_rollover_interest = FXRolloverInterestModule(records=interest_rate_records)
Fill model
Limit orders fill on a 20% probability per tick when their price is reached, and any market or marketable order draws a one-tick slip on a 50% coin flip. The seed makes the run reproducible.
fill_model = ProbabilisticFillModel(
    prob_fill_on_limit=0.2,
    prob_slippage=0.5,
    random_seed=42,
)
Venue
OmsType.HEDGING lets the strategy carry concurrent long and short positions
in the same instrument and have the venue assign position IDs. The account is
multi-currency so PnL on USD/JPY accrues in JPY rather than being converted
on every fill.
SIM = Venue("SIM")
engine.add_venue(
    venue=SIM,
    oms_type=OmsType.HEDGING,
    account_type=AccountType.MARGIN,
    base_currency=None,
    starting_balances=[Money(1_000_000, USD), Money(10_000_000, JPY)],
    fill_model=fill_model,
    fee_model=MakerTakerFeeModel(
        maker_rate=Decimal("0.00002"),
        taker_rate=Decimal("0.00002"),
    ),
    modules=[fx_rollover_interest],
)
Instrument and data
TestDataProvider.quotes_from_fxcm_bars synthesizes quote ticks from each
minute's open, high, low, and close in the sample FXCM bid and ask CSVs.
The strategy declares 5-MINUTE-BID-INTERNAL, so the engine builds 5-minute
BID bars from the quote stream internally.
USDJPY_SIM = TestInstrumentProvider.default_fx_ccy("USD/JPY", SIM)
engine.add_instrument(USDJPY_SIM)

ticks = provider.quotes_from_fxcm_bars(
    instrument=USDJPY_SIM,
    bid_csv="fxcm/usdjpy-m1-bid-2013.csv",
    ask_csv="fxcm/usdjpy-m1-ask-2013.csv",
)
engine.add_data(ticks)
Strategy
Trade size is one million USD per order. EMACross cancels and replaces the position on every crossover, so the strategy is in some position for nearly the whole month.
strategy_config = EMACrossConfig(
    instrument_id=USDJPY_SIM.id,
    bar_type=BarType.from_str("USD/JPY.SIM-5-MINUTE-BID-INTERNAL"),
    fast_ema_period=10,
    slow_ema_period=20,
    trade_size=Decimal(1_000_000),
)
strategy = EMACross(config=strategy_config)
engine.add_strategy(strategy=strategy)
Run
The engine processes every quote tick and bar in timestamp order, then returns when the data is exhausted.
engine.run()Reports
engine.generate_* returns DataFrames covering the account state, the
fills, and the closed positions.
engine.generate_account_report(SIM)engine.generate_order_fills_report()engine.generate_positions_report()What the run produces
A 28-day run prints 8,065 5-minute bars and triggers 234 closed cycles across 468 fills (every crossover after the first emits a closing fill on the previous position and an opening fill on the new one). 70 of the 234 cycles are profitable. Realized PnL ends at -1,326,300 JPY, of which 871,300 JPY is commission: a textbook whipsaw signature on a noisy 5-minute series.
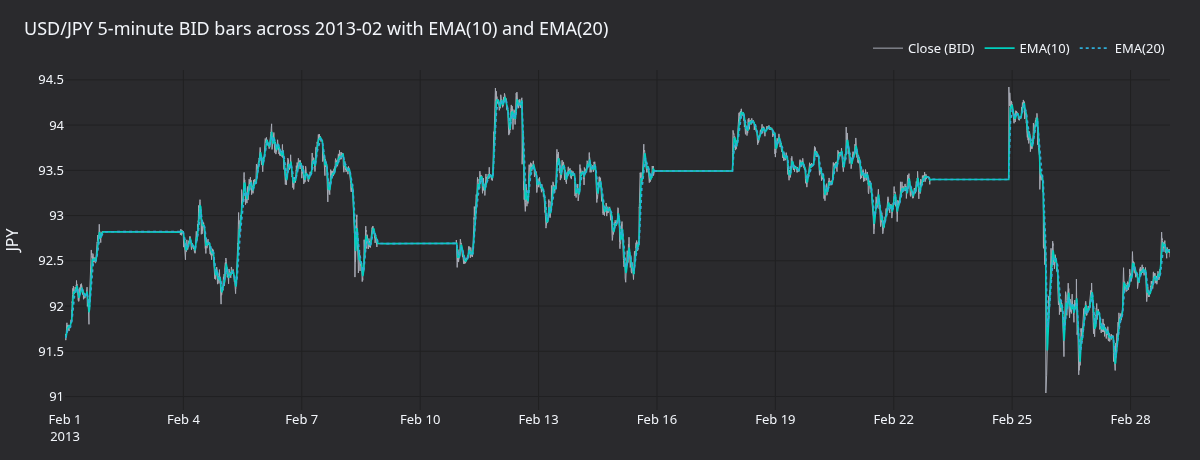
Figure 1. USD/JPY BID close at 5-minute resolution across 2013-02 with EMA(10) and EMA(20) overlaid. Long flat patches are weekend gaps in the FXCM bid feed.
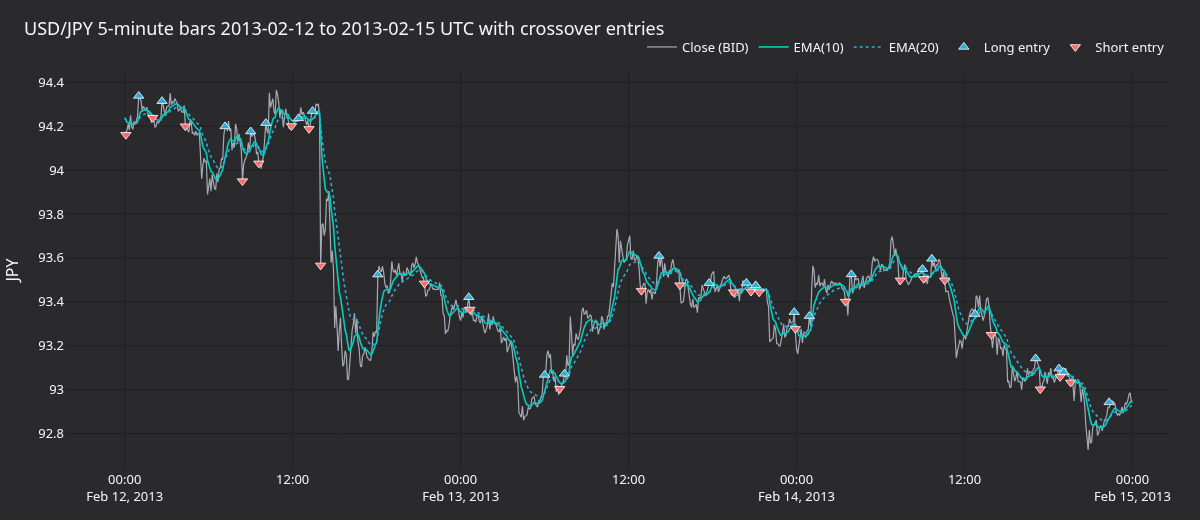
Figure 2. Zoom on 2013-02-12 to 2013-02-15 UTC. Each marker is a crossover entry: triangles up are long, triangles down are short.
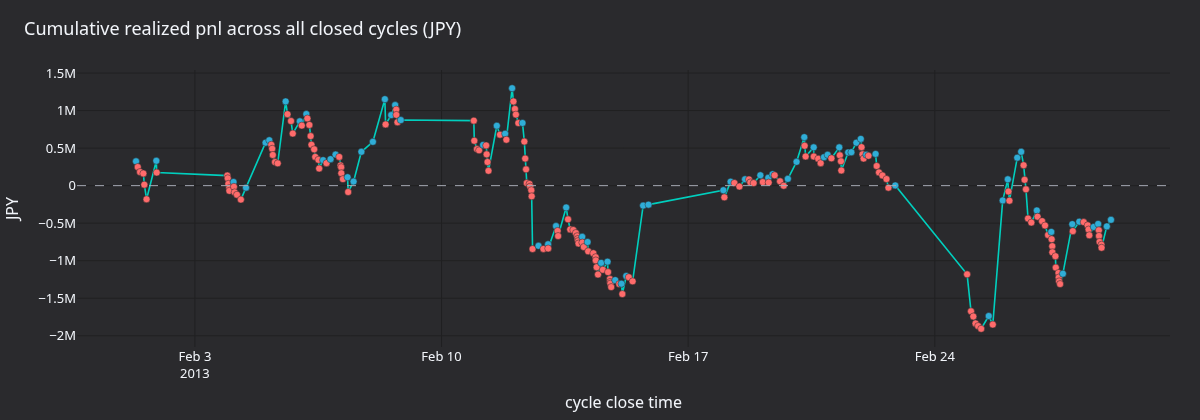
Figure 3. Cumulative JPY pnl before commissions across all closed cycles. Marker color encodes per-cycle pnl: blue = positive, red = negative.
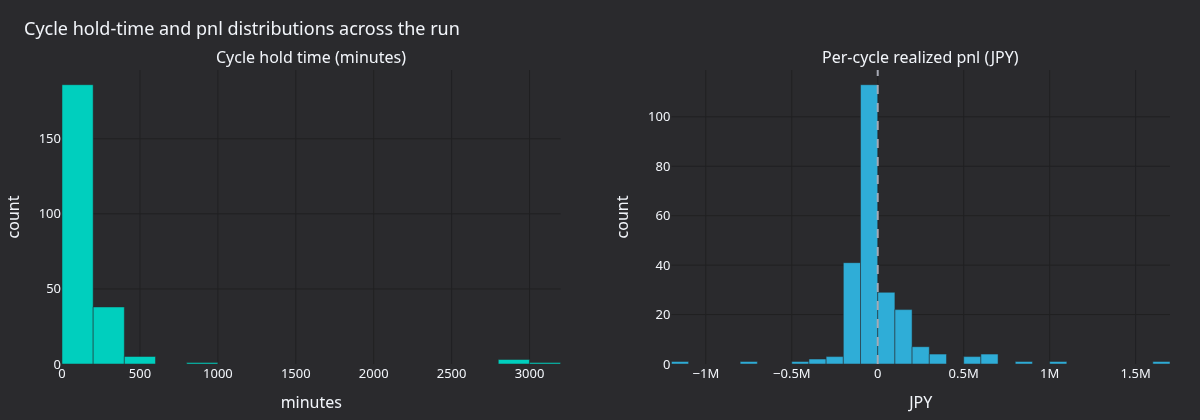
Figure 4. Cycle hold time and per-cycle pnl distributions. Most cycles hold for under three hours; the pnl distribution is roughly symmetric and heavily concentrated near zero.
Regenerate the panels
The panels above are produced by a self-contained renderer that re-runs the
backtest, pulls bars and fills from the engine cache, and writes PNGs using
the shared nautilus_dark tearsheet theme.
After building NautilusTrader from source, run these commands from the repository root:
make sync
uv run --project python --no-sync \
    python docs/tutorials/assets/backtest_fx_bars/render_panels.py
Next steps
- Slow the signal. The default 10/20 EMAs whip in low-trend sessions. Try 20/60 on the same bars or move to 15-minute bars to cut the cycle count.
- Add a regime filter. Suppress entries when realized range is below a threshold so the strategy only trades sessions with directional movement.
- Compare aggregations. Build the bars from raw tick data via
BarType.from_str("USD/JPY.SIM-5-MINUTE-BID-INTERNAL")against an externally aggregated dataset to confirm both paths agree.
Hurst/VPIN Directional Strategy (Kraken Futures)
This tutorial backtests a directional strategy on PF_XBTUSD, the USD-margined Bitcoin perpetual on Kraken Futures. The strategy combines a Hurst-exponent...
Backtest with Order Book Depth Data (Binance)
Replay Binance T_DEPTH order book deltas through BacktestNode and run an imbalance strategy that fires fill-or-kill (FOK) limit orders when one side of the...